2. User Guide: Buildings Tool
The CanCurve Buildings Tool creates Depth-Damage Functions (DDF) for archetypal Canadian buildings using detailed restoration cost data. The resulting DDFs can be used to estimate potential costs and losses from flood scenarios using a flood risk modelling tool such as CanFlood. The tool joins restoration cost data with information on an item’s vulnerability to floods. It then groups the data by flood depth to create a simple function that represents flood damage in relation to flood depth.
2.1. Introduction
Canada is a large country with diverse and varied geographies. Many communities are built on floodplains, near lakes and coastlines, exposing areas to short and long-term impacts from flooding. These impacts can include economic losses, environmental damage, and impacts on people. With climate change projections indicating more frequent and severe natural hazards, these consequences will likely escalate. Flood risk assessments are essential to plan and prepare adaptation strategies that can reduce future costs and suffering. Traditionally, assessments have focused on a single flood scenario, which can lead to an underestimation or overestimation of modelled impacts. A more effective approach is a risk-based approach that considers a range of flood scenarios - from frequent nuisance floods to rare catastrophic events. This approach helps communities to better understand and plan for a range of strategies that address both current and future flood risks. Water on the floodplain is not the problem; it is how flood water interacts with both the natural and human environments. Flood risk models take into account the flood hazard data, exposure to flooding, and the vulnerability of those elements. DDFs are the most effective method to estimate direct damages. For instance, DDFs can estimate the costs of damage to a building based on the depth of floodwater. However, the accuracy of these models depends on the robustness of the DDF applied. In Canada, there are limited DDFs available, and many may not be suitable for all regions due to variations in both the built environment and the type of flood events, from flash floods to ice jams, high-energy coastal floods or even tsunamis.
2.1.1. Depth-Damage Functions (DDF)
Flood damage functions are a mathematical relationship between hazard and vulnerability variables against the estimated damages from flooding (e.g., building repair costs) for an individual asset. The most basic functions directly relate flood depth to damage — the so-called depth-damage curves or functions (DDF) widely attributed to Gilbert White [5]. Damage functions are typically categorized based on the model’s focus or objective, such as the sector (residential vs. non-residential), tangibility (tangible vs. intangible), damage mechanism (indirect vs. direct), and uncertainty treatment (deterministic vs. probabilistic) [6]. Further classification considers the function structure such as continuity (discrete vs. continuous) and for tangible economic functions the asset total value relation (relative vs. absolute). While depth-damage functions are still common, research in the past two decades has advanced the understanding of flood damage processes and, along with new data and techniques, has led to more sophisticated and accurate multi-variate models [7]. CanCurve currently supports discrete, tangible, absolute, single-variable, depth-damage functions.
2.1.2. Flood Risk Modelling in Canada
Natural Resources Canada (NRCan) develops and maintains flood risk software and data tools to support disaster resilience in Canada. In particular, NRCan maintains CanFlood, a QGIS plugin for building and running flood risk models. A major input or component of CanFlood models are DDFs. Traditionally, CanFlood users struggled to obtain DDFs from past projects or public repositories, leading to inefficient and inaccurate risk modelling. To address this gap, in 2023 NRCan commissioned the Arcadis company to develop a system for constructing local DDFs in Canada. This resulted in a formal process for constructing DDFs called Program for the Development of Flood Damage (Vulnerability) Curves for buildings in Canada (a.k.a. the DDF Program or DDFP). To operationalize this, NRCan initiated the CanCurve project.
2.2. Welcome Tab
The Welcome Tab provides a brief introduction to the Buildings Tool and links to the User Guide and Project Page. If you want to load a tutorial dataset, select one of the Tutorial Case Examples by loading the testing values button. See Tutorials for data examples.
2.3. Metadata Tab
Metadata is used by the Buildings Tool to populate metadata fields on output DDFs and assemble the DDF. The user is expected to obtain this information from expert knowledge and documentation on the archetype building. Enter available information into the Metadata tab. Only fields marked with an asterisk (*) are mandatory, but the more information you provide, the more complete your DDF will be. To assemble the DDF, the following metadata is required:
Building Layout (
bldg_layout): Corresponds to categories in the DRF Database.Basement height value (
basement_height_m): The height of the basement in meters, used to concatenate the cost values between storeys.Structure area value (
scale_value): The area of the structure in square meters used to scale the cost values for Area-based cost basis.Scale factor (
scale_factor): Factor for scaling all cost values. Can be useful for spatio-temporal transfers.
Specifying additional metadata fields is recommended, as the Buildings Tool will include them in the output DDFs. For example data, see the Tutorials.
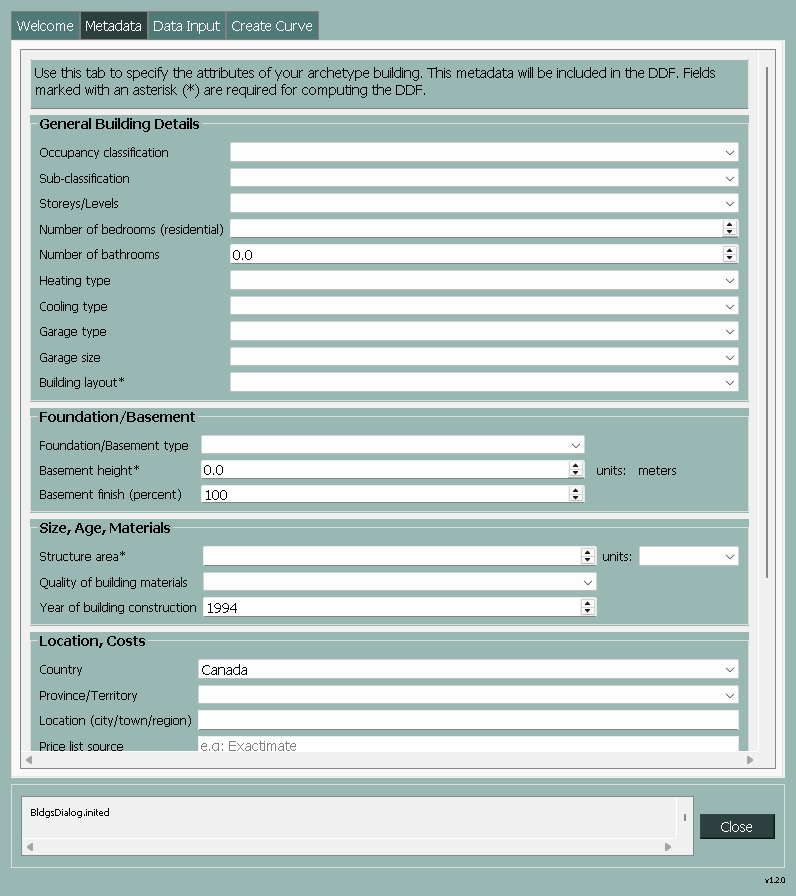
Figure 2.1 Metadata tab of the Buildings Tool.
2.4. Data Input Tab
Specify settings and locations for the three main datasets.
2.4.1. Cost-item table
This table provides detailed information on restoration costs for various items. The data is specified as a CSV file and is typically sourced from cost restoration experts using specialized software like Xactimate, combined with a detailed model of the building structure.
2.4.2. Fixed Costs
This dataset contains fixed restoration costs for the basement and main floor. These costs represent the sum of all depth-invariant cost items, i.e., costs that are incurred regardless of flood depth, such as mobilization fees or permit charges.
2.4.3. Depth-Replacement Factor (DRF) Database
This dataset includes information on the Depth-Replacement Factor, which is essential for calculating restoration costs based on flood depth. This database relates flood depth to the percentage loss or damage of a restoration item. By default, the DRF Database included with CanCurve will be used, and is installed into the ./db directory of the CanCurve plugin. The database was developed in consultation with cost-restoration specialists and reflects the vulnerability of a typical Canadian building to stillwater flooding. Figure 2.3 provides a diagram of how the remote, local, and project datasets are related.
- The DRF Database is a SQLite database with three tables:
cost_item_meta: lookup and description fields for each cost-item with key fields
category,component, andbldg_layout.drf: the depth-replacement-factor for each cost-item with key fields
category,component, andbldg_layout.depths: depth values (in feet and meters) corresponding to the columns in the DRF table.
meta: metadata for the database.
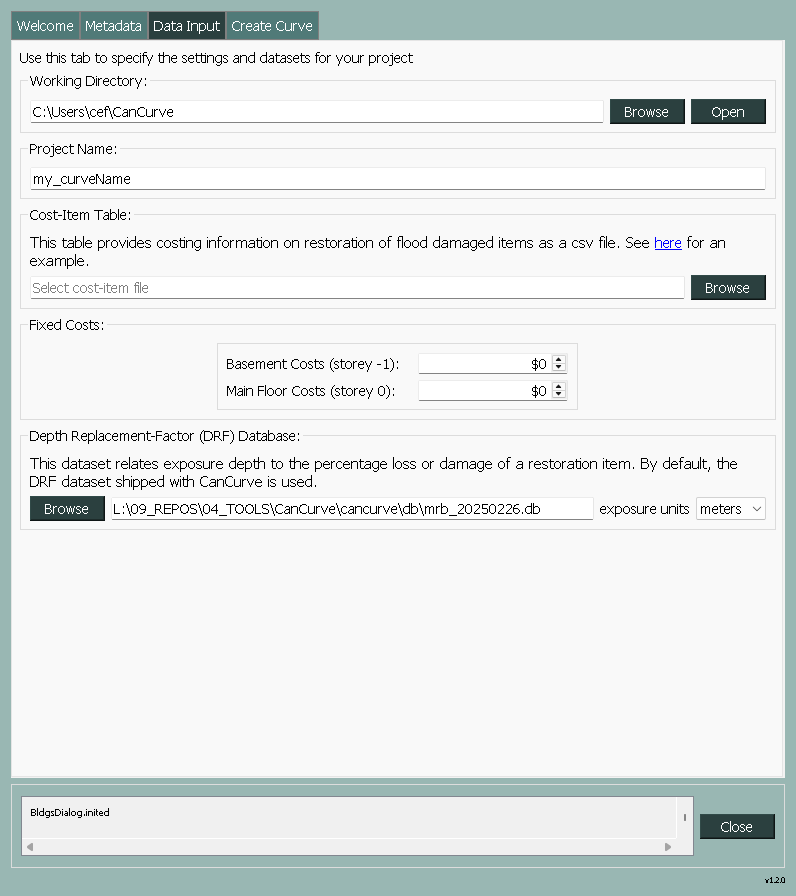
Figure 2.2 Data Input tab of the Buildings Tool.
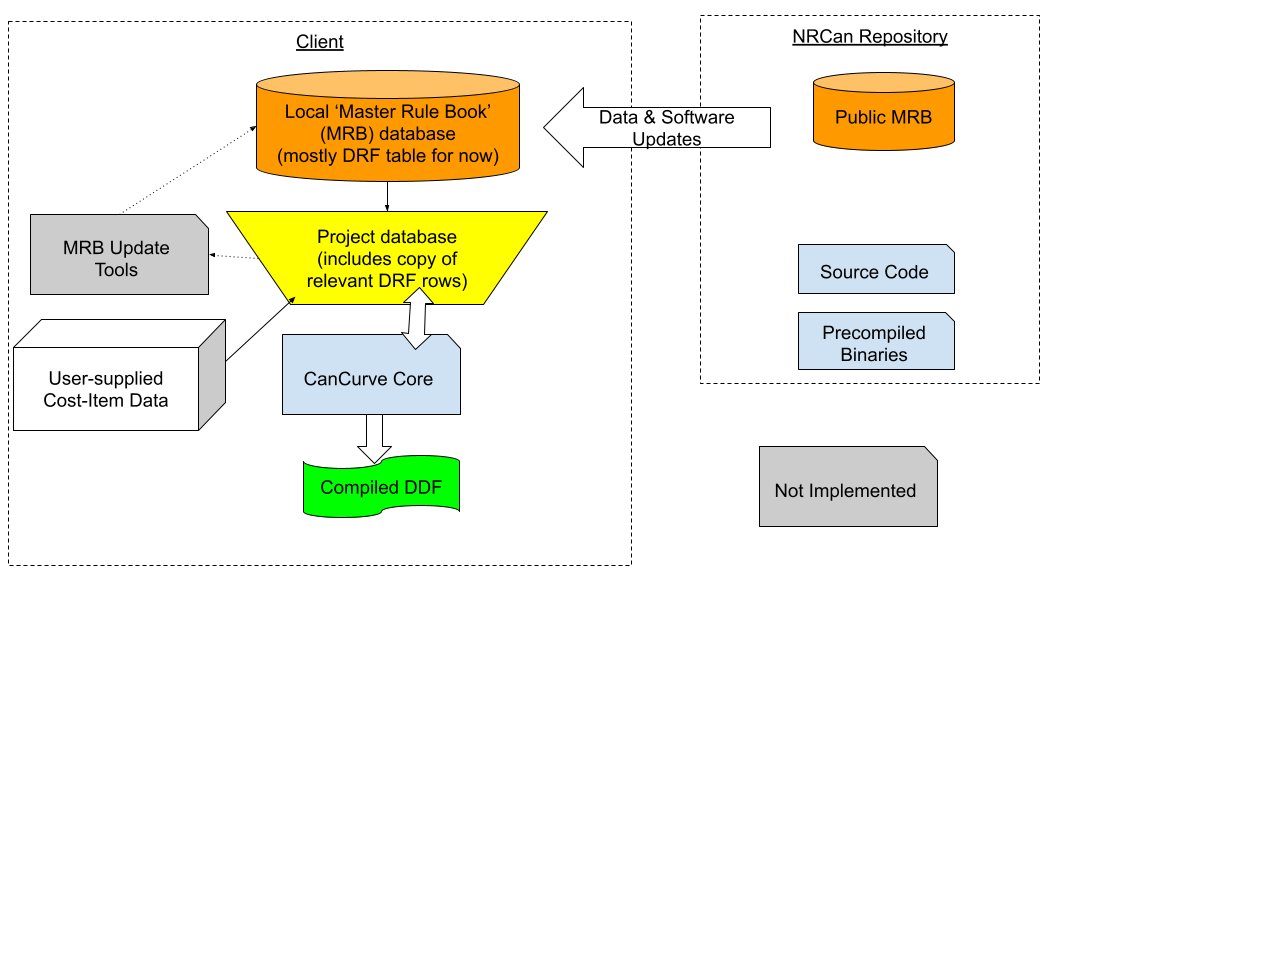
Figure 2.3 Conceptual diagram of the CanCurve Buildings Tool.
2.5. Create Curve Tab
The Create Curve tab is where the user can execute the four steps of the Curve Creation process to generate a DDF from the input data and settings Figure 2.4. These steps can be executed individually or all at once using the Run Control radio buttons. For additional configuration settings, the Output Control box can be expanded to specify plot settings, the DDF output format, and the Cost-Basis. The first three steps of the Curve Creation process write intermediate SQLite tables to the project database. Because of this, you can save and restore progress by selecting an existing Project Database file.

Figure 2.4 Create Curve tab of the Buildings Tool.
2.5.1. Core: Curve Creation Steps
At the core of the Buildings Tool are four curve creation steps that are executed sequentially to generate a DDF. These are controlled from the Create Curve tab and can be executed individually or all at once. To pass information between these steps and to save the user’s progress to disk, all steps (excluding the last) read or write tables to the Project Database. You can think of the first three steps as a collection of database operations to create a depth-damage table, with the fourth step exporting this table into the format expected by a risk model.
Setup project: Construct the Project Database and load data into it from the GUI.
Data join and multiply costs: Join DRF Database to the Cost-Item table, then multiply through to create fractional restoration costs. See also Incomplete DRF.
Data group and concat stories: Group restoration costs by storey and concatenate them into a single table.
Export DDF: Export the DDF in the CanFlood format.
For more information on the intermediate tables generated by these steps, see Project Database tables.
2.5.1.1. Incomplete DRF
The DRF Database is a critical component of the Buildings Tool, as it relates flood depth to the percentage loss or damage of a restoration item. If the DRF Database does not contain a replacement factor for a cost item, the Buildings Tool will not be able to calculate the restoration costs for that item. In these cases, a warning will be shown and the DRF Data Entry Tool shown below will be automatically opened on the first attempt to run Step 2.
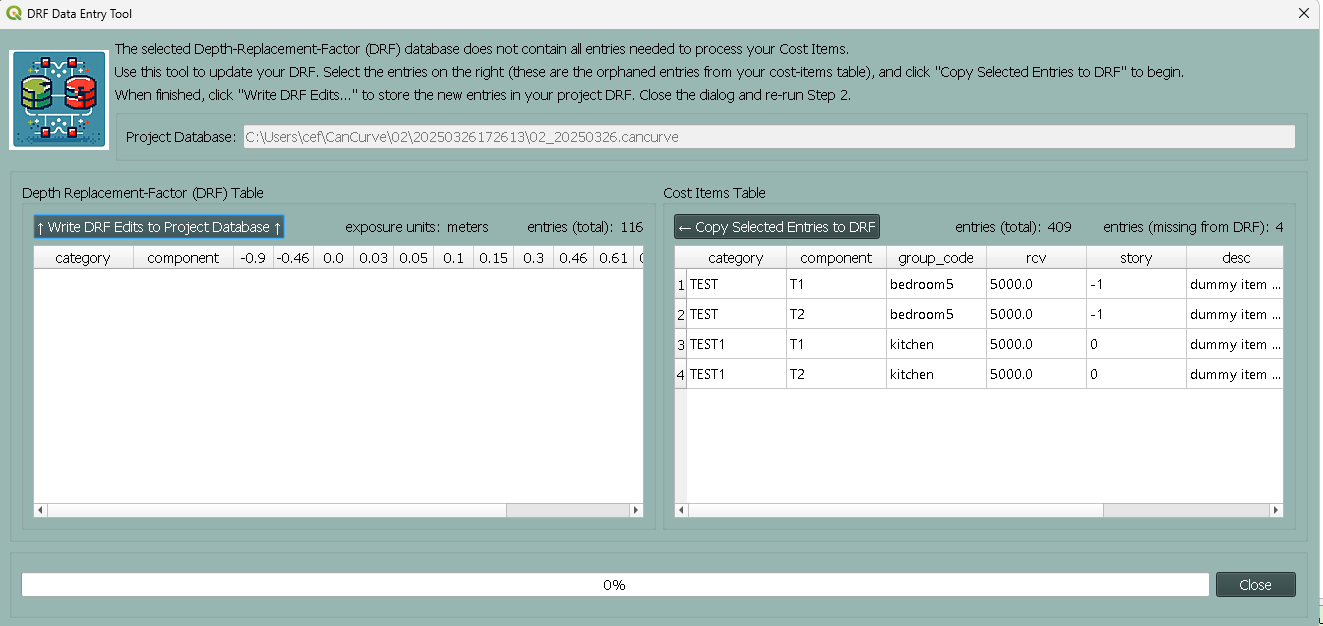
Figure 2.5 DRF Data Entry Tool.
This dialog facilitiates updating the project DRF by adding replacement factors for each depth for the orphaned entries in the cost-item table. Once finished, the project DRF table will be appended and the workflow can proceed as normal (from Step 2). Alternatively, users can manually update the project database using 3rd party tools, or remove the orphaned entries from the cost-items table.
Users should be aware tha the master rule book file (shipped with CanCurve) will not be modified by this process, and the user will need to manually update the master rule book if they wish to use the updated DRF in future projects. Similarly, if a user erases the project database (e.g., by re-running Step 1), these changes will be lost.
2.5.2. Summary Figures
The Create Curve tab provides the user with the option to generate diagnostic figures or plots to better understand the results of the database operations of the first three core steps. Generating the figures is optional, and can be controlled via the Output Control box and selecting the Individual Steps radio button. Data displayed on the figures is read directly from the corresponding tables of the Project Database.
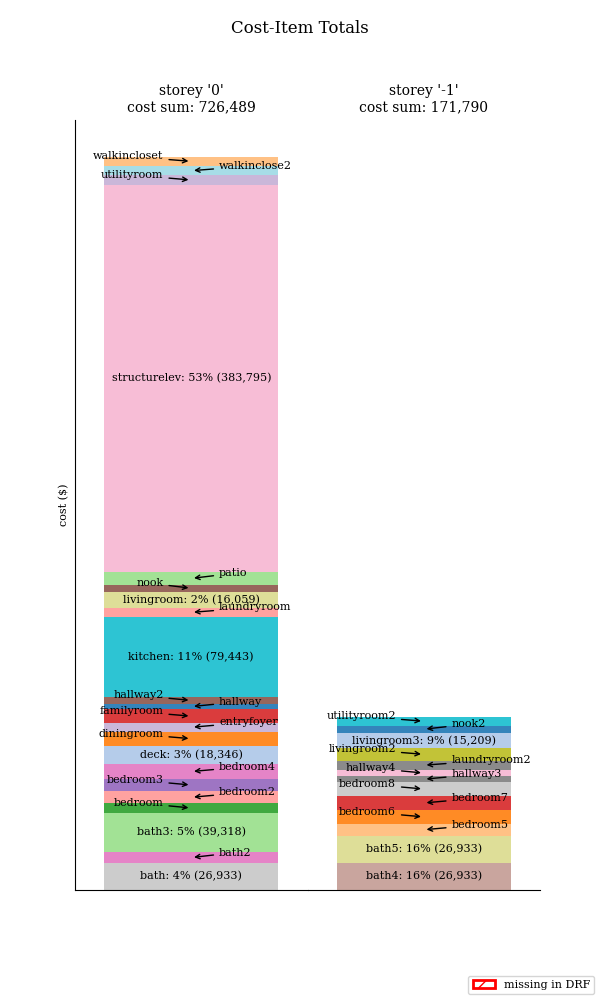
2.5.2.1. Cost-Item Totals Figure
This bar chart summarizes the total cost of each cost item in the Cost-Item table created in Step 1.
2.5.2.2. DRF Figure
This collection of plots summarize the replacement factors contained in the DRF table, grouped by category. An average of all items within a category is also shown as a dashed black line. This figure can be useful to quickly diagnose problems with the DRF data.

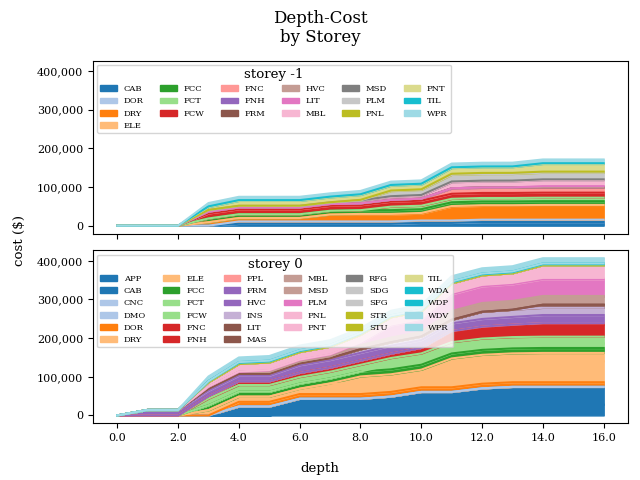
2.5.2.3. Depth-Costs by Storey Figure
This stacked line plot shows the costs for each storey in the building as a function of exposure depth from the Depth-Costs table. This figure can be helpful to understand the main contributions to your DDF.
2.5.2.4. DDF Figure
This plot shows the final DDF for the building read from the DDF table.

2.6. Results
CanCurve supports exporting DDFs in the CanFlood format.
2.6.1. CanFlood Format DDF
Currently, the buildings tool supports exporting DDFs in the CanFlood format. The CanFlood program expects DDFs to be in a certain format, namely an XLSX file with two columns divided into two sections. The first section contains the metadata in key-value pairs while the second section contains the exposure-impact series. CanFlood requires three keys in the metadata section:
tag: used for linking the DDF to the inventory.
impact_units: used for indicating what units the impact values are in (e.g., $CAD) on plots and reports.
exposure: used to indicate the transition between the metadata and the exposure-impact sections.
It is good practice to include additional metadata (e.g., location); however, these are not strictly required by CanFlood. Below is a minimum example CanFlood format DDF.
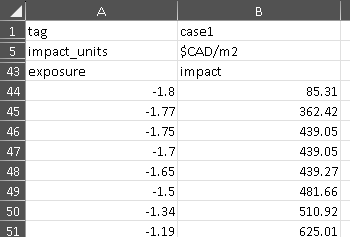
Figure 2.6 CanFlood format DDF minimum example.
2.7. Key Concepts
The Buildings Tool is composed of the Graphical User Interface (GUI) front-end and a collection of python scripts for performing the data operations in the back-end, called the core which contains four Curve Creation steps.
2.7.1. Project Database
The Project Database is a SQLite database that the Buildings Tool creates for each project, then uses to store the data and metadata for the project. For most workflows, the Project Database is hidden in the background; however, knowledge of the project database can be useful for debugging, understanding the tool’s operation, saving your work for later, and custom applications. To view and manipulate the project database, the user can use a SQLite database viewer like DB Browser for SQLite. The database is composed of several tables, each of which is written and read by one or more of the curve creation steps, as shown in Table 2.1 and elaborated in the following sections.
Table Name |
Description |
Step |
|---|---|---|
c00_bldg_meta |
Building metadata |
1 |
c00_cost_items |
Cost-Item table |
1 |
c00_drf |
DRF Database [8] |
1 |
c00_fixed_costs |
Fixed costs |
1 |
c01_depth_rcv |
Fractional item cost for each depth |
2 |
c02_ddf |
DDF for each storey |
3 |
project_meta |
Metadata tracking operations on the db |
all |
project_settings |
Project settings |
1 |
2.7.1.1. c00_bldg_meta
Key fields extracted from the Metadata tab.
expo_units |
bldg_layout |
basement_height |
scale_value_m2 |
scale_factor |
|---|---|---|---|---|
meters |
default |
1.8 |
232.1 |
1.1 |
2.7.1.2. c00_cost_items
Copy of the user-supplied Cost-item table table. drf-intersect column is added to indicate if the cost item intersects with the DRF database.
cat |
sel |
group_code |
rcv |
story |
desc |
drf_intersect |
|---|---|---|---|---|---|---|
FCW |
AV+ |
laundryroom2 |
397.45 |
-1 |
Oak flooring - select grade - no finish |
1 |
PNT |
BF |
bedroom6 |
200.32 |
-1 |
Paint bifold door set - slab only - 2 coats (per side) |
1 |
PNT |
BF |
bedroom5 |
200.32 |
-1 |
Paint bifold door set - slab only - 2 coats (per side) |
1 |
PNT |
S |
bath4 |
117.87 |
-1 |
Seal the surface area w/latex based stain blocker - one coat |
1 |
PNT |
S |
bath4 |
49.45 |
-1 |
Seal the surface area w/latex based stain blocker - one coat |
1 |
2.7.1.3. c00_drf
Extract of the user-specified Depth-Replacement Factor (DRF) data. Header values correspond to the exposure depth in the project units.
cat |
sel |
-0.9 |
-0.46 |
0 |
0.03 |
0.05 |
0.1 |
0.15 |
0.3 |
0.46 |
0.61 |
0.76 |
0.91 |
1.02 |
1.22 |
1.52 |
1.83 |
2.7 |
|---|---|---|---|---|---|---|---|---|---|---|---|---|---|---|---|---|---|---|
APP |
CTG+ |
0 |
0 |
0 |
0 |
0 |
0 |
0 |
0 |
0 |
0 |
1 |
1 |
1 |
1 |
1 |
1 |
1 |
APP |
DW++ |
0 |
0 |
0 |
0 |
0 |
0 |
1 |
1 |
1 |
1 |
1 |
1 |
1 |
1 |
1 |
1 |
1 |
APP |
FRBI+ |
0 |
0 |
0 |
0 |
0 |
0 |
1 |
1 |
1 |
1 |
1 |
1 |
1 |
1 |
1 |
1 |
1 |
APP |
GD+ |
0 |
0 |
0 |
0 |
0 |
0 |
0 |
0 |
0 |
1 |
1 |
1 |
1 |
1 |
1 |
1 |
1 |
2.7.1.4. c00_fixed_costs
Extract of the user-supplied fixed cost Fixed Costs data.
story |
rcv |
|---|---|
0 |
10000.0 |
-1 |
8000.0 |
2.7.1.5. c01_depth_rcv
Join of the Cost-item table and Depth-Replacement Factor (DRF) Database tables with the fractional restoration costs for each depth multiplied through.
cat |
sel |
story |
-0.9 |
-0.46 |
0 |
0.03 |
0.05 |
0.1 |
0.15 |
0.3 |
0.46 |
0.61 |
0.76 |
0.91 |
1.02 |
1.22 |
1.52 |
1.83 |
2.7 |
|---|---|---|---|---|---|---|---|---|---|---|---|---|---|---|---|---|---|---|---|
FCW |
AV+ |
-1 |
0 |
0 |
0 |
397.45 |
397.45 |
397.45 |
397.45 |
397.45 |
397.45 |
397.45 |
397.45 |
397.45 |
397.45 |
397.45 |
397.45 |
397.45 |
397.45 |
PNT |
BF |
-1 |
0 |
0 |
0 |
200.32 |
200.32 |
200.32 |
200.32 |
200.32 |
200.32 |
200.32 |
200.32 |
200.32 |
200.32 |
200.32 |
200.32 |
200.32 |
200.32 |
PNT |
BF |
-1 |
0 |
0 |
0 |
200.32 |
200.32 |
200.32 |
200.32 |
200.32 |
200.32 |
200.32 |
200.32 |
200.32 |
200.32 |
200.32 |
200.32 |
200.32 |
200.32 |
PNT |
S |
-1 |
0 |
0 |
0 |
0 |
0 |
0 |
0 |
0 |
0 |
0 |
0 |
0 |
0 |
0 |
117.87 |
117.87 |
117.87 |
2.7.1.6. c02_ddf
Concatenated restoration costs for each storey.
depths_m |
main |
base |
combined |
|---|---|---|---|
-1.8 |
11000 |
8800 |
19800 |
-1.77 |
11000 |
73118.86 |
84118.86 |
-1.75 |
11000 |
90903.87 |
101903.87 |
-1.7 |
11000 |
90903.87 |
101903.87 |
2.7.1.7. project_meta
Metadata and tracking of each operation performed by CanCurve onto the database. Useful for debugging.
script_name |
script_path |
now |
username |
cancurve_version |
python_version |
platform |
qgis_version |
function_name |
misc |
|---|---|---|---|---|---|---|---|---|---|
core.py |
L:09_REPOS04_TOOLSCanCurvecancurvebldgs |
2024-10-29 16:18:07.927856 |
cef |
1.0.0 |
3.12.3 |
Windows 10 |
3.34.5-Prizren |
c00_setup_project |
{‘ci_fp’: ‘c:\GD\10_IO\CanCurve\test_data\bldgs\case1\R_1-L-BD-CU_ABCA.csv’, ‘drf_db_fp’: ‘L:\09_REPOS\04_TOOLS\CanCurve\cancurve\db\mrb_20241007.db’} |
core.py |
L:09_REPOS04_TOOLSCanCurvecancurvebldgs |
2024-10-29 16:18:09.282604 |
cef |
1.0.0 |
3.12.3 |
Windows 10 |
3.34.5-Prizren |
c01_join_drf |
|
core.py |
L:09_REPOS04_TOOLSCanCurvecancurvebldgs |
2024-10-29 16:18:09.868796 |
cef |
1.0.0 |
3.12.3 |
Windows 10 |
3.34.5-Prizren |
c02_group_story |
{‘scale_m2’: False, ‘basement_height’: 1.8, ‘scale_value_m2’: None, ‘scale_factor’: 1.1} |
2.7.1.8. project_settings
Project settings not related to the specific archetype.
param |
val |
|---|---|
scale_m2 |
False |
curve_name |
case1_c00 |
expo_units |
meters |
2.7.2. Cost Basis
The Buildings Tool supports two cost bases:
Total ($/structure): The resulting DDF will reflect the total restoration costs for the archetype as a function of depth. This can be useful for debugging and for risk models with very similar structures. For DDFs of this type, the calculated impacts should not be scaled.
Area-based ($/area): The resulting DDF will reflect the restoration costs per area of the structure as a function of depth. The units of the DDF impact values can be $/ft^2 or $/m^2 depending on what was specified in the Structure area field on the Metadata tab. This basis is useful for adapting the resulting archetypal DDF to other structures by scaling the impact values by the area of the structure. Most CanFlood models use this cost basis.
2.7.3. Units
The Buildings Tool is unit-agnostic, meaning any units you specify are supported. Any units explicitly specified (e.g., through drop downs) or implicitly (e.g., through input data) are propagated into CanFlood’s project tables and the final DDF outputs. In other words, there are no unit conversions under-the-hood, by design. Users should be aware of the three main units concerning DDFs:
Currency: This is related to the Cost Basis, and is input implicitly from the Cost Items table. Users should ensure the Currency drop down on the Metadata tab is consistent with this table so that the resulting DDF metadata is accurate.
Vertical Distances: Both the exposure depths and the basement heights must be provided in the same units (no checks are performed on this). These units are specified on the Data Input tab under exposure units (feet or meters). These values are used to calculate the exposure depths on the resulting DDF.
Structure Area: To calculate area-based curves, the user must provide a Structure area value and unit on the Metadata tab (ft2 or m2). These units must be consistent with the intended application of the DDFs. For example, if you plan to use building area as a scaler in your flood risk model, the units of the area in the exposure data must match the units of your DDF. Often this is the same system as the vertical distance (e.g., metric), but this is not a requirement, i.e., a curve with a vertical distance of meters and an area of square feet is valid.