3. Tutorials
This section contains a collection of tutorials with example data and results. Be sure to read and follow the Getting Started Section before attempting these tutorials.
3.1. Tutorial 1: Single-storey Residential
This tutorial will demonstrate how to create a CanFlood format DDF from a Cost-Item Table and some default values for a single-storey residential building using the Buildings Tool.
3.1.1. Step 1: Download the example Cost-Item Table
From the project repository, download the example Cost-Item Table somewhere easy to find. Alternatively, select Tutorial 01 from the drop down on the Welcome tab and skip to Step 4.
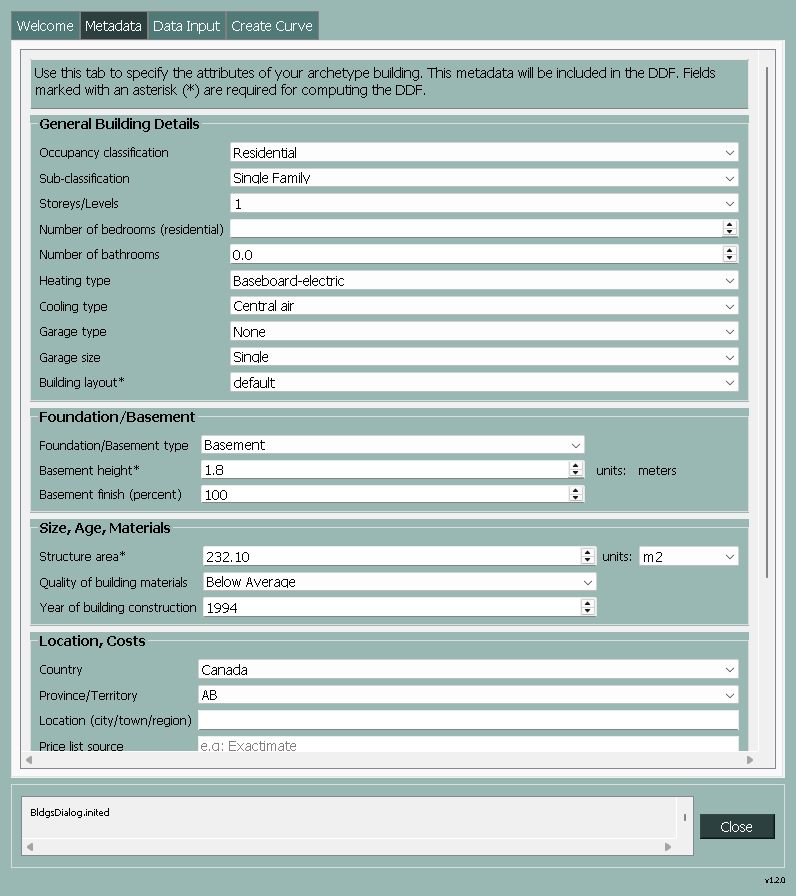
3.1.2. Step 2: Enter Metadata
Open the Buildings Tool, navigate to the Metadata tab, and populate the fields as shown below:
3.1.3. Step 3: Data Input
Navigate to the Data Input tab and, using the below image for reference, populate the following fields:
Working Directory: choose your own path or use the default
Project Name: choose your own name or use the name shown
Cost-Item Table: browse to the downloaded example Cost-Item Table .csv file from Step 1.
Fixed Costs: enter the two values shown below.
Cost Basis: For this tutorial we will use Area Based.
DRF Database: By default, the field should be populated with the filepath to the DRF Database that ships with CanCurve.
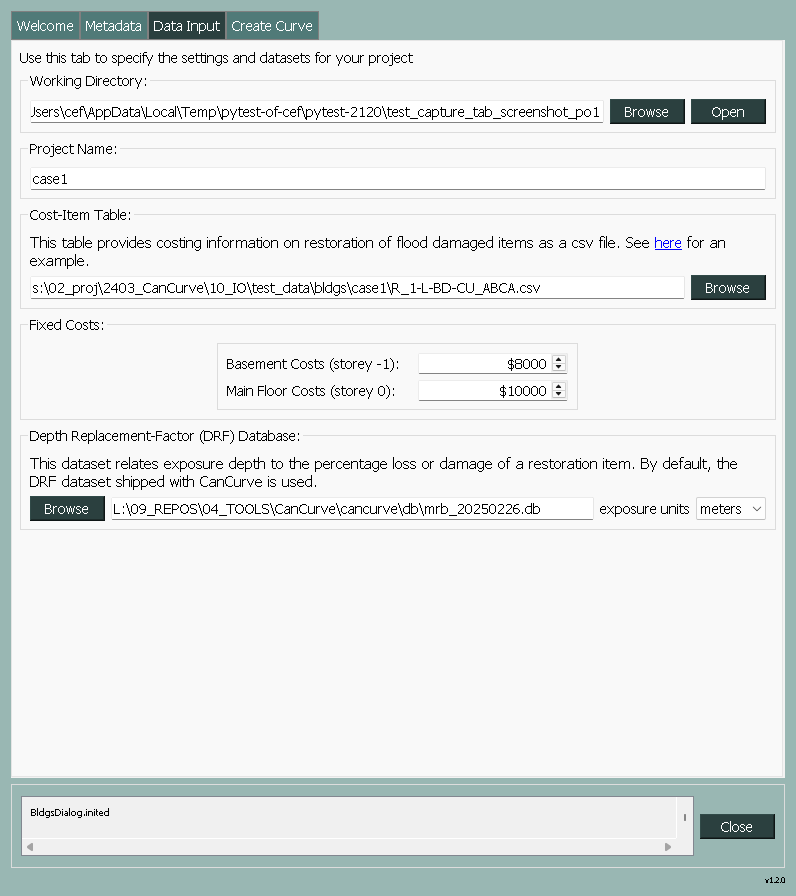
Figure 3.1 Data Input page for Tutorial 1
3.1.4. Step 4: Create Curve
Navigate to the Create Curve tab. In the Run Control box, select All, then click Run. You should see the progress of each of the four Curve Creation Steps along with a message in the bottom window informing you that the DDF has been output to the Working Directory you specified in Step 3, similar to what is shown below.
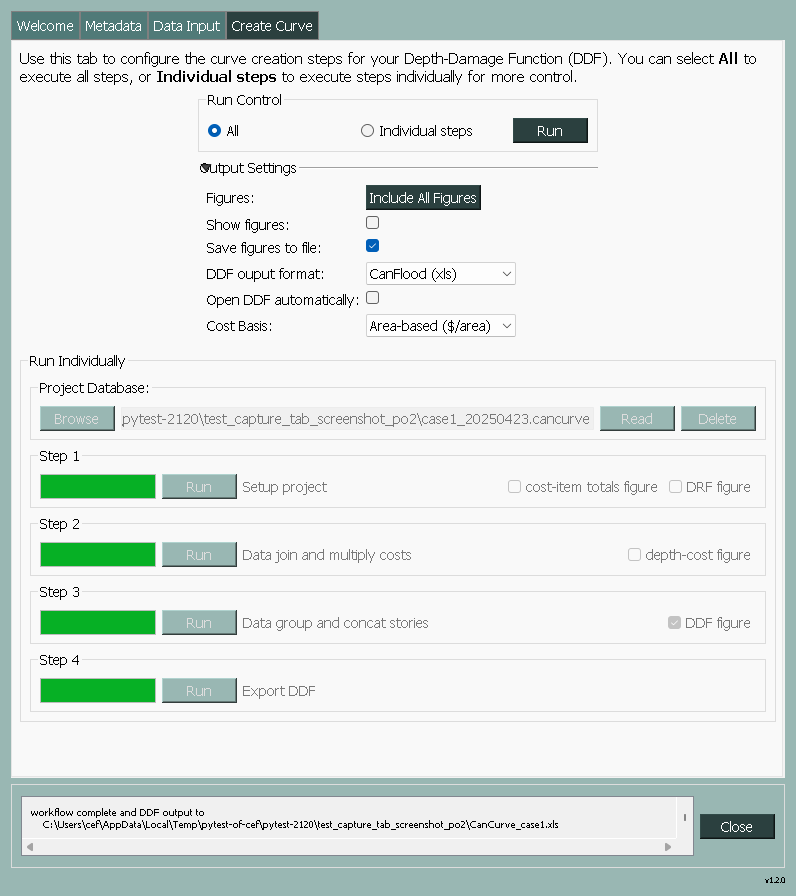
Figure 3.2 Curve Creation page for Tutorial 1
For additional log messages, you can return to the main QGIS window, open the log panel (View>Panels>Log Messages), and select the CanCurve tab. Scrolling up, you should see diagnostic messages for each of the four steps you just ran. This is the end of a typical workflow; however, the Buildings Tool provides for some additional functionality and output control that you may wish to explore. For example, selecting the Individual Steps radio button will allow you to specify your own project database and generate some diagnostic plots for each step. Similarly, expanding the Output Control box shows some additional options for controlling the output of the tool.